A deep dive into the topology of a DC network: where conversion losses arise, how to remove them and what that means for a farm, a neighbourhood or a business park. With single-line diagrams and measurement graphs from our own test setup.
RByRob Arkesteijn
·2 min read
Why direct current?
With alternating current (AC) the current reverses direction fifty times per second — handy for transforming voltage and transporting it over long distances. Our entire public grid is built that way.
With direct current (DC) the energy flows in one direction, at a constant voltage. Solar panels, batteries, heat pumps and charging points all run on direct current internally. Today we first convert it to AC for the grid, and back to DC for the device at the other end — every conversion costs energy.
Read our concept first for the basics behind AC versus DC.
In short
In a local grid with lots of solar, storage and charging it often pays to connect the sources and consumers directly on a shared DC bus, and convert only once at the grid coupling.
The topology of the network
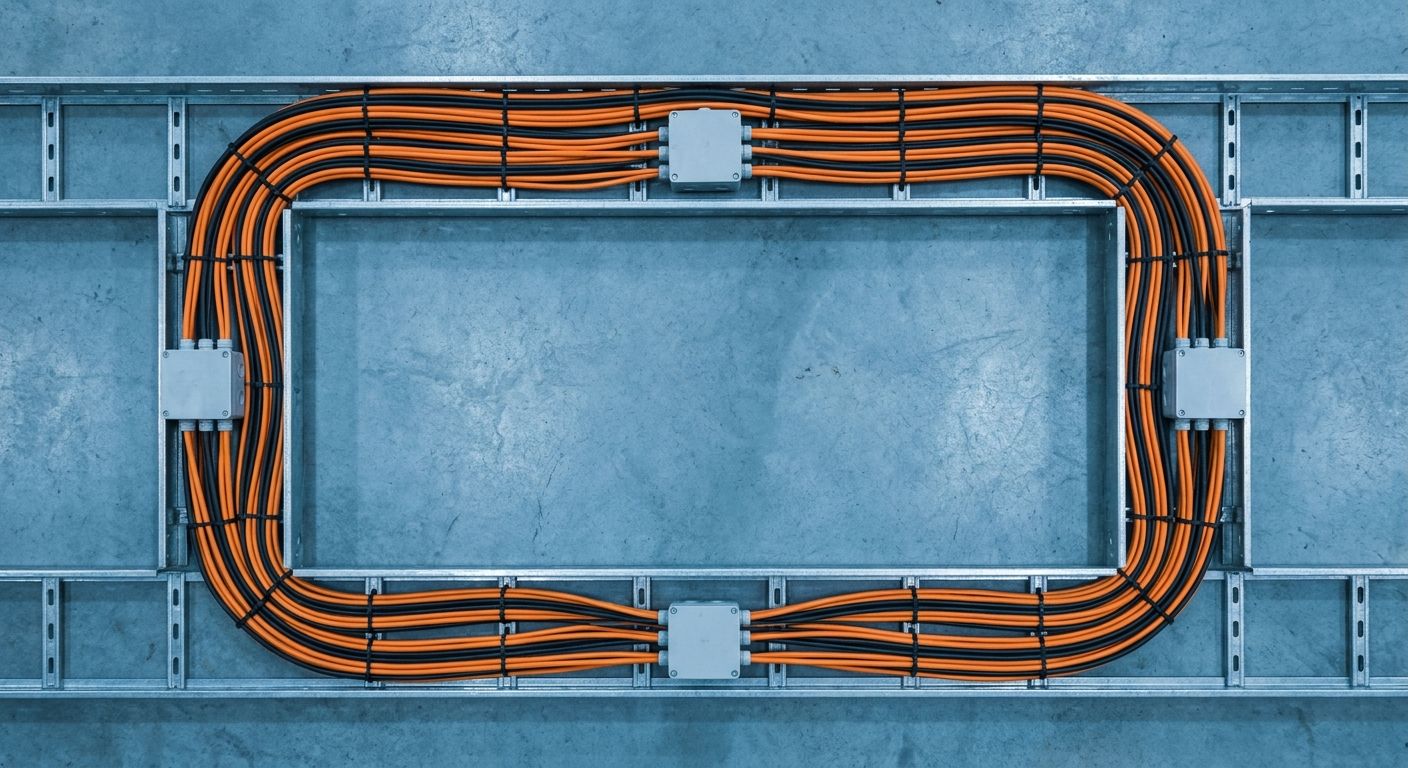
The shape of a local DC grid determines its reliability and measurability. At its core you connect sources, storage and consumers to one shared bus — node NODE_01_DELFT in our test setup — with a single controlled conversion to the public grid.
Every connection point is individually measurable and controllable.
A single grid coupling keeps the whole cooperating neatly with the AC grid.
Expansion happens by hanging a new branch on the bus, not by redesigning the grid.
Fig. 1 — Single-line diagram of the DC section
Conversion and loss
Solar inverters and charging points switch at high speed. On the AC grid they inject high-frequency harmonics — pollution the grid has to absorb. A DC section removes a large part of that complexity: fewer converters means fewer harmonics and less loss.
A well-designed DC grid takes unnecessary conversions out of the chain — and with them the losses and the invisibility of what is happening.
Rob Arkesteijn · Network engineer
Specifications of the test setup
The setup is deliberately kept small: large enough to mimic the energy flows realistically, small enough to adjust quickly. These are the key figures of the shared bus.
Delft test setup — key data
Parameter
Value
Unit
Bus voltage
700
V DC
Continuous power
48
kW
Solar PV
12
kWp
Battery storage
30
kWh
Measured efficiency
97.4
%
What we learned in Delft
What first stood on paper is now physically running. Where a comparable AC network loses the flows partly out of sight at every conversion, on direct current everything stays measurable, shareable and controllable — down to every connection point.
Over the coming weeks we expand the setup step by step with a second charging point and a larger battery. We share the measurement data openly, so the whole sector grows along.
Wondering whether direct current fits your situation?
From a farm to a business park — we are glad to work a concrete case through with you. No sales pitch, just a conversation about the engineering and what it gets you.